You can use Python with examiner, thanks to the support
for Python in RStudio and library(knitr) via
library(reticulate). Just load reticulate and
start Python chunks with ```{python} instead of the usual
```{r}.
This article assumes you have managed to install and use Python as
described in the reticulate documentation.
A note on virtual environments: Fully automatic package installation via py_require() is used only when reticulate does not detect an existing Python environment (for example, a virtual environment in your project). If an environment is already present, you should install any required Python packages there in your usual way before importing them.
Some rich content from Python may need an R wrapper around them. Below we illustrate a few such solutions.
To test this on your system, make an examiner
project and create a question Rmd from the template
New File > R Markdown > From Template > demo_python.
Making Python available to reticulate
Read the reticulate docs on how to make this
work. The code below should work out of the box, as managing
Python packages became much easier when reticulate 1.41
started bundling the uv package
manager for Python.
library(reticulate)
# Packages for graphics, tables, and animated images:
py_require(c("pandas", "matplotlib", "ffmpeg", "tabulate", "imageio-ffmpeg"))
Plain text Python output
The following chunk begins with ```{python}, so it will be run with the python engine.
## {'This': 4, 'is': 2, 'a': 1, 'test': 4}Matplotlib graphics
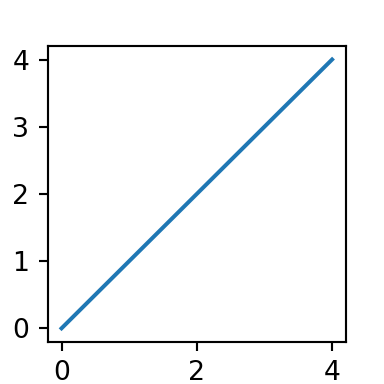
Figures will display automatically in the generated report if they
are open when the chunk ends, even if you don’t call the usual
plt.show(). (plt.show() is still needed for
interactive sessions.)
Python figures cannot be sized via knitr chunk options. Instead,
plt.figure(figsize = ..., dpi = ...) or
fig.set_size_inches() or fig.set_dpi(), see
below.
Pandas data frames
The default plain text display works as expected.
import pandas as pd

data = {
    'Column 1': ['Row1-Col1', 'Row2-Col1'],
    'Column 2': ['Row1-Col2', 'Row2-Col2'],
    'Column 3': ['Row1-Col3', 'Row2-Col3']
}

table = pd.DataFrame(data, index=['Row 1', 'Row 2'])
table
## Column 1 Column 2 Column 3
## Row 1 Row1-Col1 Row1-Col2 Row1-Col3
## Row 2 Row2-Col1 Row2-Col2 Row2-Col3For Pandas’ HTML format (ugly) or Markdown (slightly prettier), store
the generated markup in a Python string, which you then display from an
R chunk using htmltools::HTML(). (Printing from the Python
chunk will wrap the output in <pre><code> tags
so the markup doesn’t render.)
Python chunk:
R chunks:
htmltools::HTML(py$table_html)| Column 1 | Column 2 | Column 3 | |
|---|---|---|---|
| Row 1 | Row1-Col1 | Row1-Col2 | Row1-Col3 |
| Row 2 | Row2-Col1 | Row2-Col2 | Row2-Col3 |
To output generated markdown, use the chunk option
results="asis".
cat(py$table_md)| Column 1 | Column 2 | Column 3 | |
|---|---|---|---|
| Row 1 | Row1-Col1 | Row1-Col2 | Row1-Col3 |
| Row 2 | Row2-Col1 | Row2-Col2 | Row2-Col3 |
Matplotlib animations
Canvas has a 16 kB limit on question size, and WISEflow does not
allow inline images. Hence, animated gifs or mp4 videos must be saved by
your code and then included with Markdown or
knitr::include_graphics(). With this workaround, animation
in Matplotlib works well.
mp4 export requires ffmpeg, which is bundled with
imageio_ffmpeg. We still need to tell matplotlib where to
find ffmpeg; see below.
import matplotlib as mpl
import matplotlib.pyplot as plt
import imageio_ffmpeg
import numpy as np

import matplotlib.animation as animation

fig, ax = plt.subplots()
fig.set_size_inches(3, 2)
fig.set_dpi(72)

x = np.arange(0, 2*np.pi, 0.01)
line, = ax.plot(x, np.sin(x))


def animate(i):
    line.set_ydata(np.sin(x + 2 * np.pi * i / 50))  # update the data.
    return line,


ani = animation.FuncAnimation(fig, animate, interval=20, blit=True, save_count=50)

# pillow is the "python imaging library", included with matplotlib
ani.save("animation_python.gif", writer = "pillow", fps = 20)

# Default writer is ffmpeg, but we must tell matplotlib where to find it
mpl.rcParams["animation.ffmpeg_path"] = imageio_ffmpeg.get_ffmpeg_exe()
ani.save("animation_python.mp4", fps = 20)

# Close the figure to prevent an image of the last frame from displaying automatically
plt.close(fig)
MPEG (does not loop in Canvas)
knitr::include_graphics("animation_python.mp4")While we can set loop and autoplay
attributes as shown below, Canvas will strip them from the question
html. Thus, the following will loop if you knit it separately, but not
in Canvas.